Data Visualization in Python using Matplotlib
What is Matplotlib?
Matplotlib is a python module for creating graphs and stuff, basically for creating Data visualizations. It is the most popular data visualization module in python. Many other modules like Tensorflow uses matplotlib for visualization.
Installation :
It can be easily installed using pip command, just hit
" pip install matplotlib "
Let's start coding Now :
now we need to import our dependencies and some variables
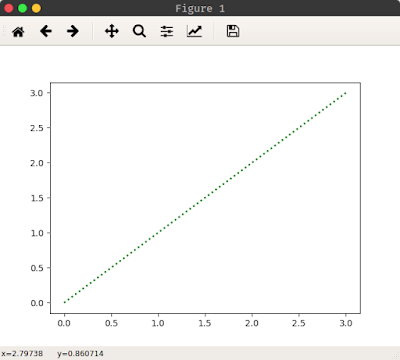
we imported matplotlib.pyplot API of matplotlib as plt. We declared to python lists to plot some values. Now we Used plt.plot() method to plot the points to plot. We passed two values in our case two python lists for x and y-axis values respectively. But this will not generate the plot for us, we have to use plt.show() method to actually show the plot. The result of the above code is below.
The output is a straight line but we can plot more complex things. In the next snippet, we will plot x^2 and x^3 values simultaneously in one plot.
Scatter Plots :
A graph in which the values of two variables are plotted along two axes, the pattern of the resulting points revealing any correlation present.
The below code snippet in an example of creating simple scatter plot in python.
the output of the above snippet is below
Bar Graph :
A bar chart or bar graph is a chart or graph that presents categorical data with rectangular bars with heights or lengths proportional to the values that they represent. The bars can be plotted vertically or horizontally. A vertical bar chart is sometimes called a line graph.
The below snippet shows how to create a simple bar graph in python.
Output :
Pie Chart in Python :
An Emma chart (or a circle chart) is a circular statistical graphic which is divided into slices to illustrate numerical proportion. In a pie chart, the arc length of each slice (and consequently its central angle and area), is proportional to the quantity it represents.
The below code snippet shows how to create a simple pie chart in python :
For pie charts plt.pie() method is used. The first parameter is the values to be plotted in our case a list. Next parameter is the label of the plotted values. The autopct parameter is to specify to show the percentage in the chart.
output :
output :
Now I covered most common types of charts in matplotlib. Let's have a question-answer round ;)
Q: How do I turn on grid in the plot?
soln: Just add a line plt.grid(True).
Q: How do I change my line colours/width/style?
soln: You can pass in the arguments colour, linewidth, and linestyle.
plt.plot(x, y, color = ‘green’ , linewidth = 2, linestyle = “-”)
Q: How do I change the transparency for my lines?
soln: Pass in the alpha parameter to your plot. Alpha can be set from 0 to 1, where 0 is completely transparent and 1 is no transparency.
plt.plot(x, y, alpha = 0.1)
Bonus: Live Plot Your CPU usage Using Matplotlib and python
%matplotlib notebook
plt.rcParams['animation.html'] = 'jshtml'
These two lines are for rendering the plot with javascript. I wrapped all this around a while loop and kept updating the plot each and every time.
Please subscribe to the blog for more programming content. If you have doubt regarding the post a comment.
Previuos post : How to create a CLI dictionary in python
https://codewithrahulbera.blogspot.com/2019/01/blog-post_54.html
Data Visualization in Python using Matplotlib
 Reviewed by Rahul
on
January 17, 2019
Rating:
 Reviewed by Rahul
on
January 17, 2019
Rating:


Great work here :)
ReplyDelete